As a freelancer, I usually get paid through multiple payment gateways depending on how convenient it is to the client, and working with multiple clients at a time is a one-way ticket to falling into the accounting nightmare.
So, I started looking for a solution to keep track of my finances and almost every software I ever found was either paid or didn't fit my needs since I mostly use cash and software like Mint would require access to bank accounts or credit cards.
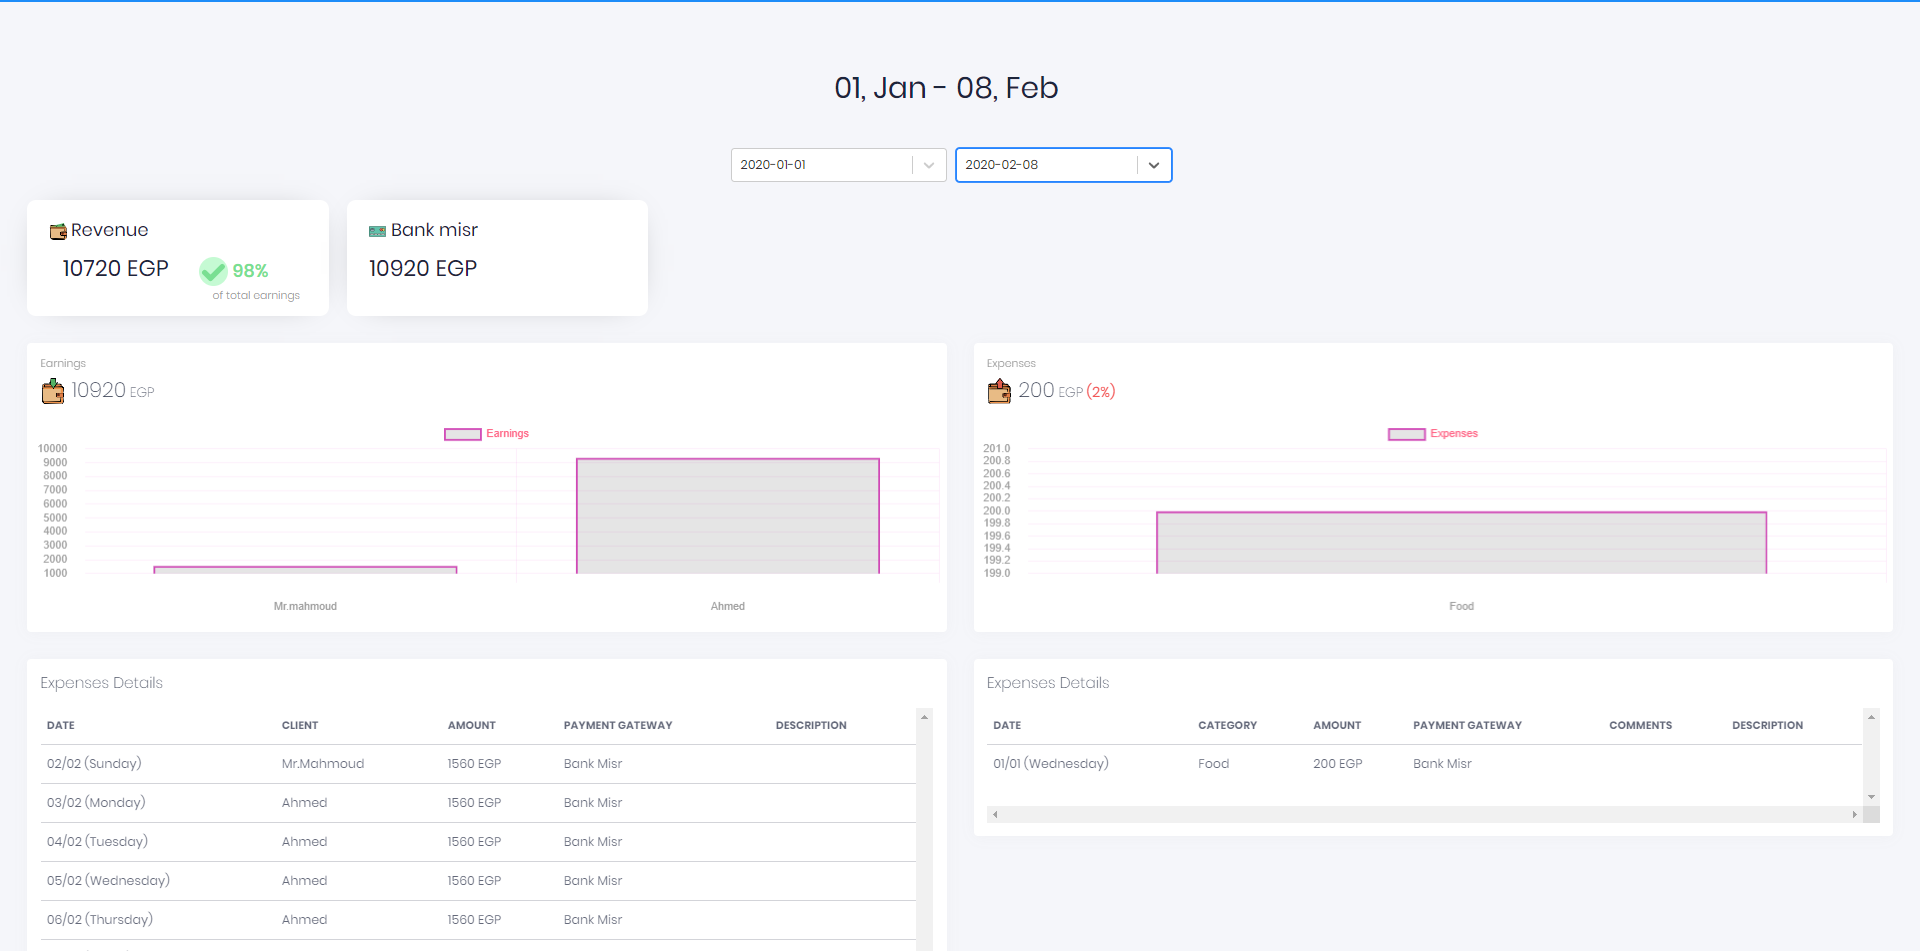
I stumbled on this YouTube video [https://www.youtube.com/watch?v=vBFcPNxjxFE] by Abdallah El Kamel, he built an awesome Excel sheet that's easy to use and has many useful features. but the charts and analyses were not enough for my needs and I didn't know much about Excel coding. I decided to parse the file and create web-based, PDF-based charts. I have been using this for over 7 months now, and it's been great but still looking forward to more features on the web frontend.
- Flask (Python3)
- Reactjs
- Backend
- api.py
- It's basically the script wrapped up into a Flask API to interact with the web frontend
- helpers.py
- Some helper functions that is used in api.py
- api.py
- Frontend
- src
- assets
- components
- layouts
- variables
- views
- index
- routes
- src
- CLI Script
- report.py
- Generates a PDF that contains a chart with how much each client paid, which is then stored in income_reports folder
- spending.py
- Generates a PDF that contains a heatmap with how much each is spent each day between the dates specified
- income_folder
- report.py
- Finances.xlsx
- The file we store all the finances in and parse later
