| title | keywords | description | ||||
|---|---|---|---|---|---|---|
zipkin |
|
Zipkin is an open-source distributed tracing system. The zipkin Plugin instruments APISIX and sends traces to Zipkin based on the Zipkin API specification. |
Zipkin is an open-source distributed tracing system. The zipkin Plugin instruments APISIX and sends traces to Zipkin based on the Zipkin API specification.
The Plugin can also send traces to other compatible collectors, such as Jaeger and Apache SkyWalking, both of which support Zipkin v1 and v2 APIs.
By default, zipkin Plugin NGINX variables configuration is set to false in the default configuration:
To modify this value, add the updated configuration to config.yaml. For example:
plugin_attr:
  zipkin:
    set_ngx_var: true
Reload APISIX for changes to take effect.
See the configuration file for configuration options available to all Plugins.
| Name | Type | Required | Default | Valid values | Description |
|---|---|---|---|---|---|
| endpoint | string | True | Zipkin span endpoint to POST to, such as http://127.0.0.1:9411/api/v2/spans. |
||
| sample_ratio | number | True | [0.00001, 1] | Frequency to sample requests. Setting to 1 means sampling every request. |
|
| service_name | string | False | "APISIX" | Service name for the Zipkin reporter to be displayed in Zipkin. | |
| server_addr | string | False | the value of $server_addr |
IPv4 address | IPv4 address for the Zipkin reporter. For example, you can set this to your external IP address. |
| span_version | integer | False | 2 | [1, 2] | Version of the span type. |
The examples below show different use cases of the zipkin Plugin.
The following example demonstrates how to trace requests to a Route and send traces to Zipkin using Zipkin API v2. You will also understand the differences between span version 2 and span version 1.
Start a Zipkin instance in Docker:
docker run -d --name zipkin -p 9411:9411 openzipkin/zipkinCreate a Route with zipkin and use the default span version 2. You should adjust the IP address as needed for the Zipkin HTTP endpoint, and configure the sample ratio to 1 to trace every request.
curl "http://127.0.0.1:9180/apisix/admin/routes" -X PUT \
  -H "X-API-KEY: ${admin_key}" \
  -d '{
    "id": "zipkin-tracing-route",
    "uri": "/anything",
    "plugins": {
      "zipkin": {
        "endpoint": "http://127.0.0.1:9411/api/v2/spans",
        "sample_ratio": 1,
        "span_version": 2
      }
    },
    "upstream": {
      "type": "roundrobin",
      "nodes": {
        "httpbin.org": 1
      }
    }
  }'
Send a request to the Route:
curl "http://127.0.0.1:9080/anything"You should receive an HTTP/1.1 200 OK response similar to the following:
{
  "args": {},
  "data": "",
  "files": {},
  "form": {},
  "headers": {
    "Accept": "*/*",
    "Host": "127.0.0.1",
    "User-Agent": "curl/7.64.1",
    "X-Amzn-Trace-Id": "Root=1-65af2926-497590027bcdb09e34752b78",
    "X-B3-Parentspanid": "347dddedf73ec176",
    "X-B3-Sampled": "1",
    "X-B3-Spanid": "429afa01d0b0067c",
    "X-B3-Traceid": "aea58f4b490766eccb08275acd52a13a",
    "X-Forwarded-Host": "127.0.0.1"
  },
  ...
}
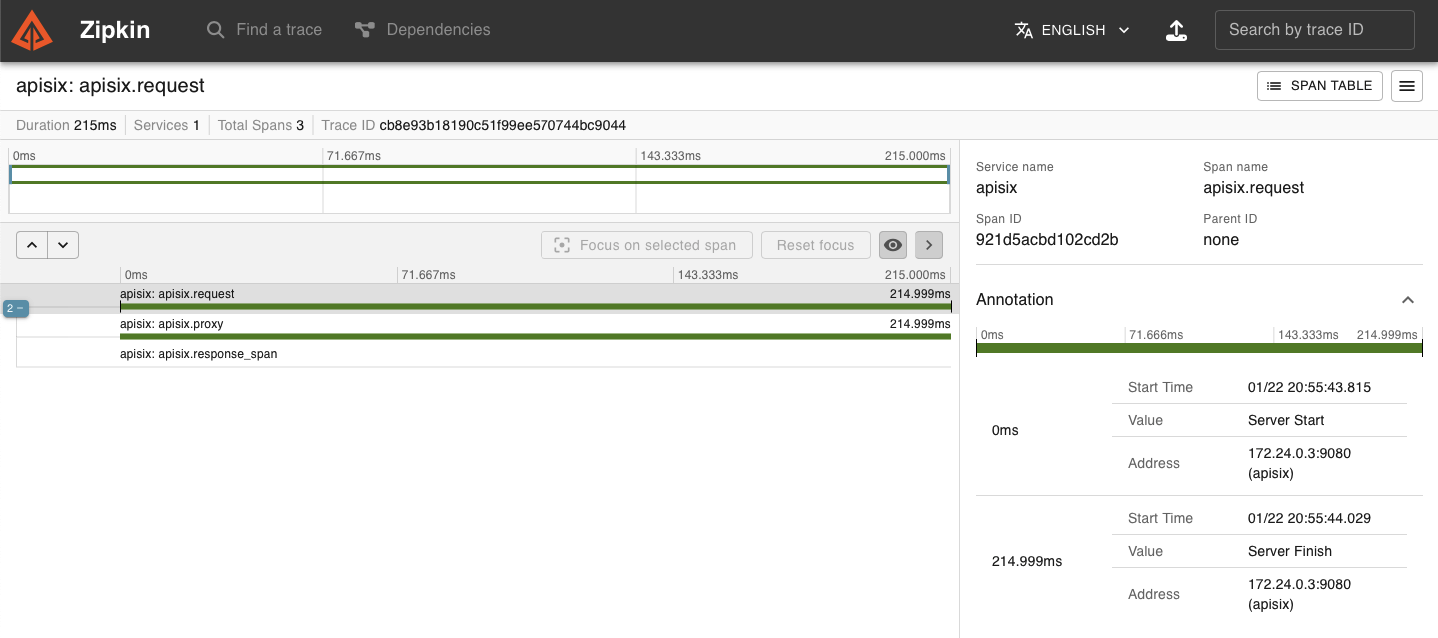
Navigate to the Zipkin web UI at http://127.0.0.1:9411/zipkin and click Run Query, you should see a trace corresponding to the request:
Click Show to see more tracing details:
Note that with span version 2, every traced request creates the following spans:
request
├── proxy
└── response
where proxy represents the time from the beginning of the request to the beginning of header_filter, and response represents the time from the beginning of header_filter to the beginning of log.
Now, update the Plugin on the Route to use span version 1:
curl "http://127.0.0.1:9180/apisix/admin/routes/zipkin-tracing-route" -X PATCH \
  -H "X-API-KEY: ${admin_key}" \
  -d '{
    "plugins": {
      "zipkin": {
        "span_version": 1
      }
    }
  }'
Send another request to the Route:
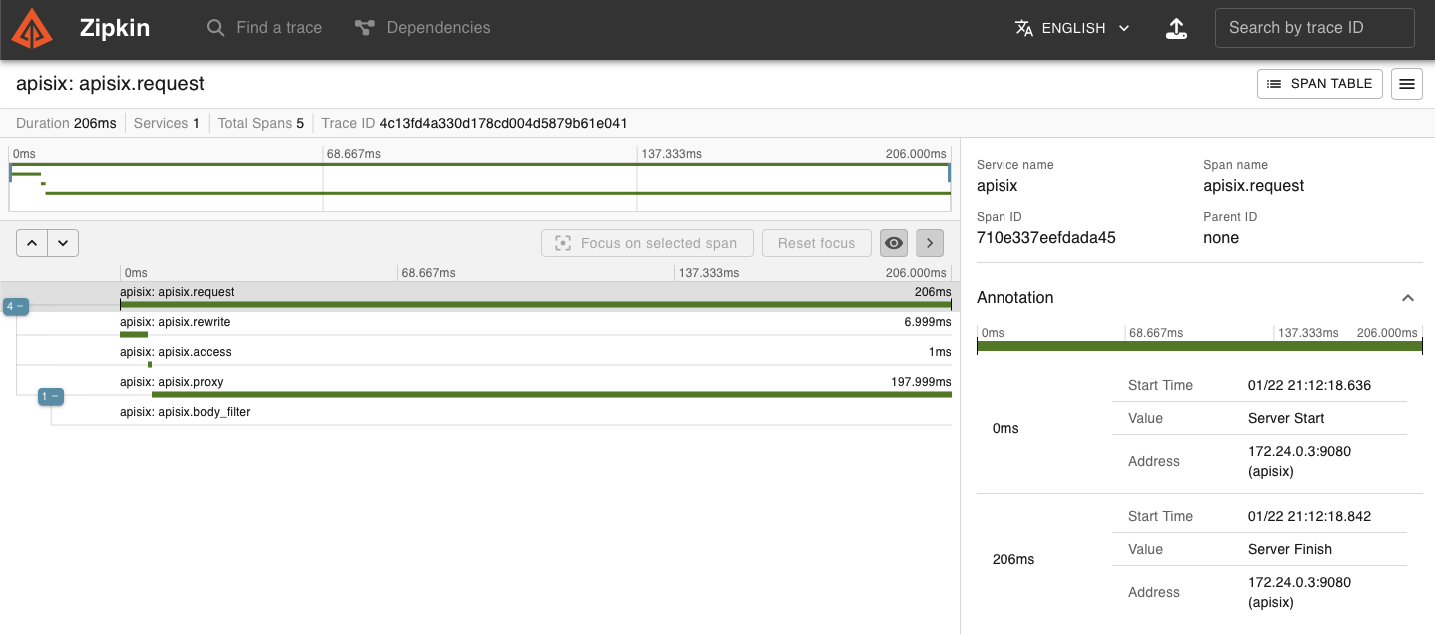
curl "http://127.0.0.1:9080/anything"In the Zipkin web UI, you should see a new trace with details similar to the following:
Note that with the older span version 1, every traced request creates the following spans:
request
├── rewrite
├── access
└── proxy
    └── body_filter
The following example demonstrates how to trace requests to a Route and send traces to Jaeger.
Start a Jaeger instance in Docker:
docker run -d --name jaeger \
  -e COLLECTOR_ZIPKIN_HOST_PORT=9411 \
  -p 16686:16686 \
  -p 9411:9411 \
  jaegertracing/all-in-one
Create a Route with zipkin. Please adjust the IP address as needed for the Zipkin HTTP endpoint, and configure the sample ratio to 1 to trace every request.
curl "http://127.0.0.1:9180/apisix/admin/routes" -X PUT \
  -H "X-API-KEY: ${admin_key}" \
  -d '{
    "id": "kin-tracing-route",
    "uri": "/anything",
    "plugins": {
      "kin": {
        "endpoint": "http://127.0.0.1:9411/api/v2/spans",
        "sample_ratio": 1
      }
    },
    "upstream": {
      "type": "roundrobin",
      "nodes": {
        "httpbin.org": 1
      }
    }
  }'
Send a request to the Route:
curl "http://127.0.0.1:9080/anything"You should receive an HTTP/1.1 200 OK response.
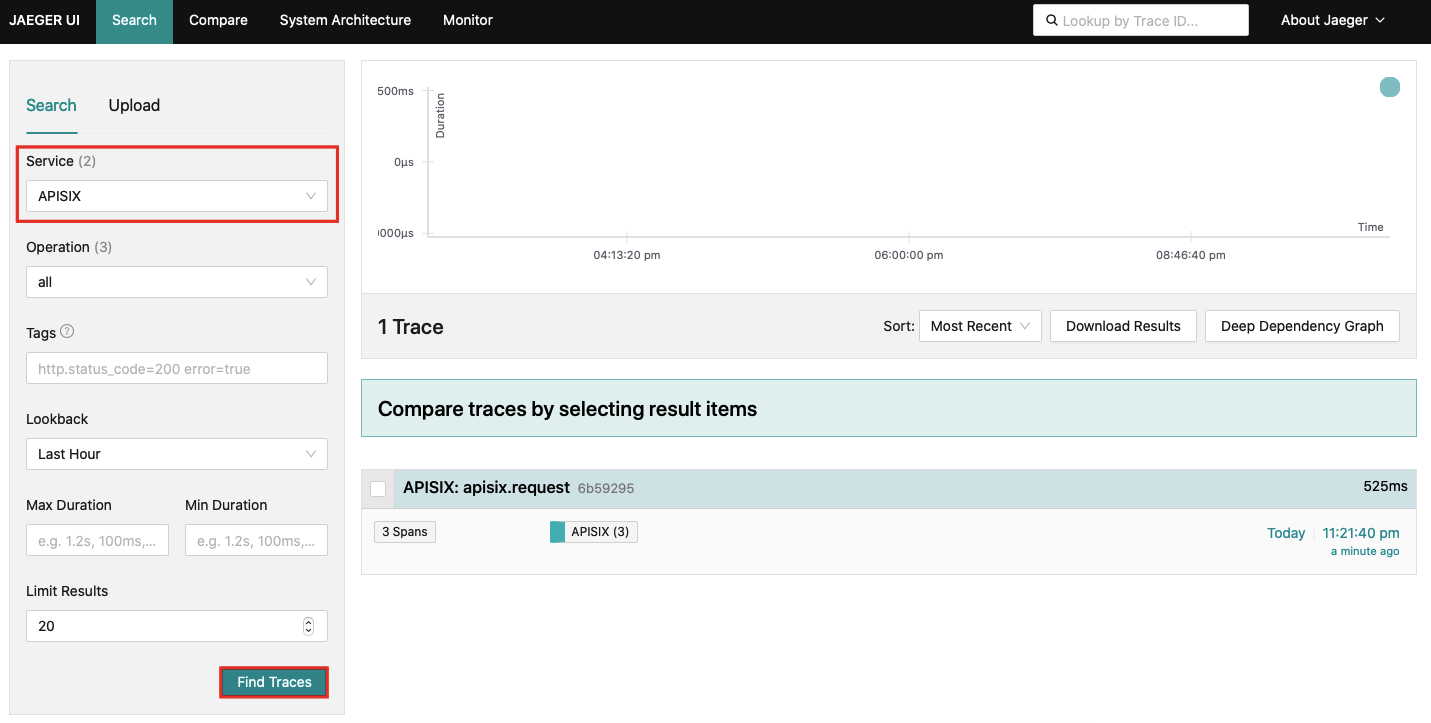
Navigate to the Jaeger web UI at http://127.0.0.1:16686, select APISIX as the Service, and click Find Traces, you should see a trace corresponding to the request:
Similarly, you should find more span details once you click into a trace:
The following example demonstrates how to configure the kin Plugin to set the following built-in variables, which can be used in logger Plugins or access logs:
kin_context_traceparent: trace parent IDkin_trace_id: trace ID of the current spankin_span_id: span ID of the current span
Update the configuration file as below. You can customize the access log format to use the zipkin Plugin variables, and set zipkin variables in the set_ngx_var field.
nginx_config:
  http:
    enable_access_log: true
    access_log_format: '{"time": "$time_iso8601","zipkin_context_traceparent": "$zipkin_context_traceparent","zipkin_trace_id": "$zipkin_trace_id","zipkin_span_id": "$zipkin_span_id","remote_addr": "$remote_addr"}'
    access_log_format_escape: json
plugin_attr:
  zipkin:
    set_ngx_var: true
Reload APISIX for configuration changes to take effect.
You should see access log entries similar to the following when you generate requests:
{"time": "23/Jan/2024:06:28:00 +0000","zipkin_context_traceparent": "00-61bce33055c56f5b9bec75227befd142-13ff3c7370b29925-01","zipkin_trace_id": "61bce33055c56f5b9bec75227befd142","zipkin_span_id": "13ff3c7370b29925","remote_addr": "172.28.0.1"}


