-
Notifications
You must be signed in to change notification settings - Fork 75
Performance Java 7
See orm-benchmarks for benchmark sources and results.
The Hibernate numbers for mysql look wrong, I need to spend some time validating them. Seem adding log4j to the pom slow thing drastically with hibernate... will need to rerun the number again with the pom modified.
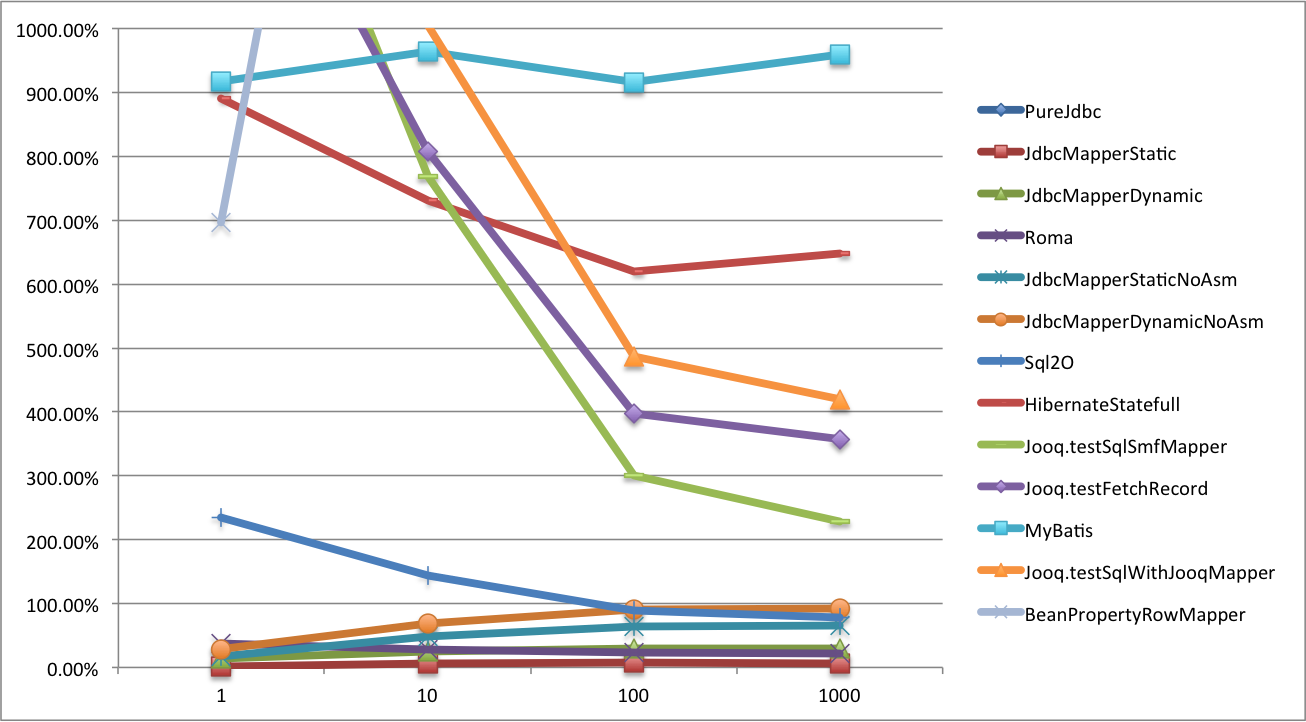
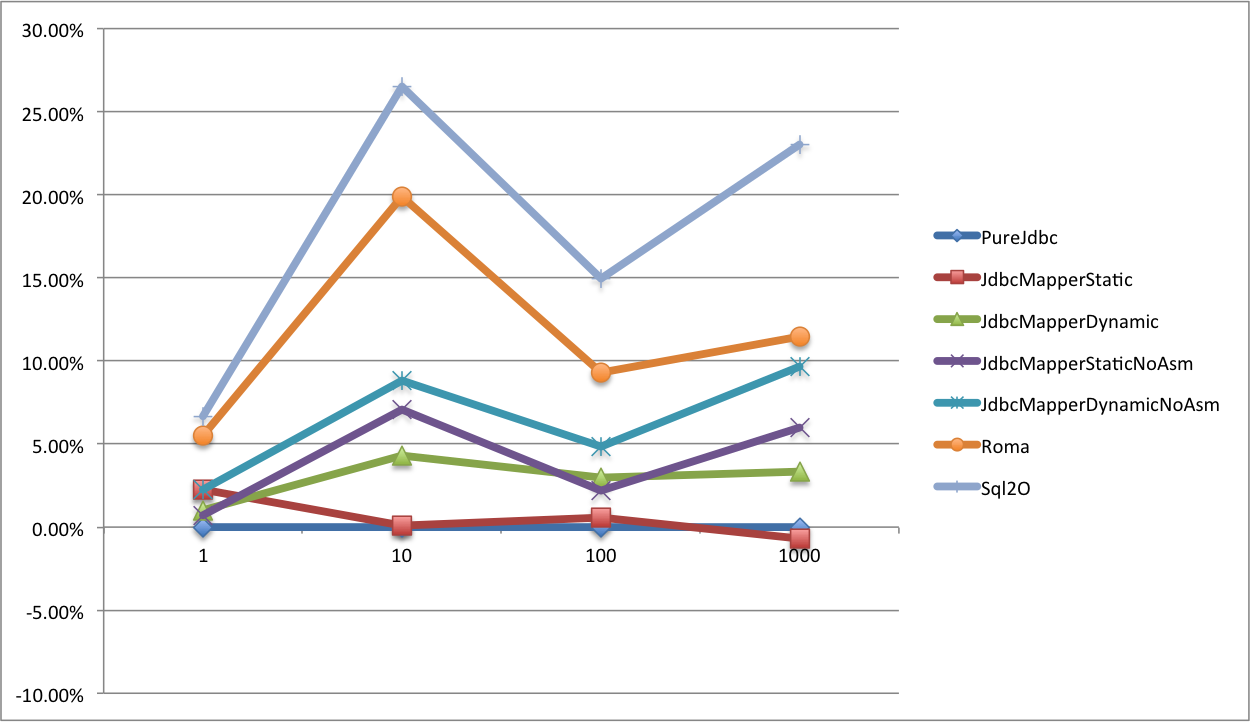
Average time ns/op to execute, fetch and map to object the result of a query with 1, 10, 100 and 1000 rows. The lower the better.
| Type/NbRows | 1 | 10 | 100 | 1000 |
|---|---|---|---|---|
| PureJdbc | 1,925.79 | 5,042.98 | 35,186.81 | 336,625.96 |
| JdbcMapperStatic | 2,019.54 | 5,255.85 | 37,673.69 | 358,678.93 |
| JdbcMapperStaticNoAsm | 2,015.28 | 5,544.55 | 41,696.29 | 399,234.51 |
| JdbcMapperDynamic | 2,181.21 | 6,218.88 | 45,714.43 | 439,786.14 |
| Roma | 2,634.56 | 6,455.94 | 43,483.63 | 410,553.17 |
| JdbcMapperDynamicNoAsm | 2,214.56 | 6,671.09 | 49,871.66 | 480,406.45 |
| Sql2O | 6,452.89 | 12,226.59 | 66,217.41 | 609,071.18 |
| Jooq.testSqlSmfMapper | 32,822.27 | 43,472.96 | 141,448.46 | 1,118,003.03 |
| Jooq.testFetchRecord | 29,460.89 | 44,009.94 | 176,350.97 | 1,559,655.25 |
| MyBatis | 20,142.78 | 52,291.87 | 359,531.09 | 3,493,167.27 |
| Jooq.testSqlWithJooqMapper | 38,604.32 | 55,232.34 | 204,774.29 | 1,772,289.92 |
| BeanPropertyRowMapper | 15,024.78 | 121,918.09 | 1,191,479.77 | 11,839,887.44 |
| 37,067.58 | 143,725.44 | 1,339,112.69 | 12,231,137.68 |
% Difference from PureJdbc Average Time, the lower the better
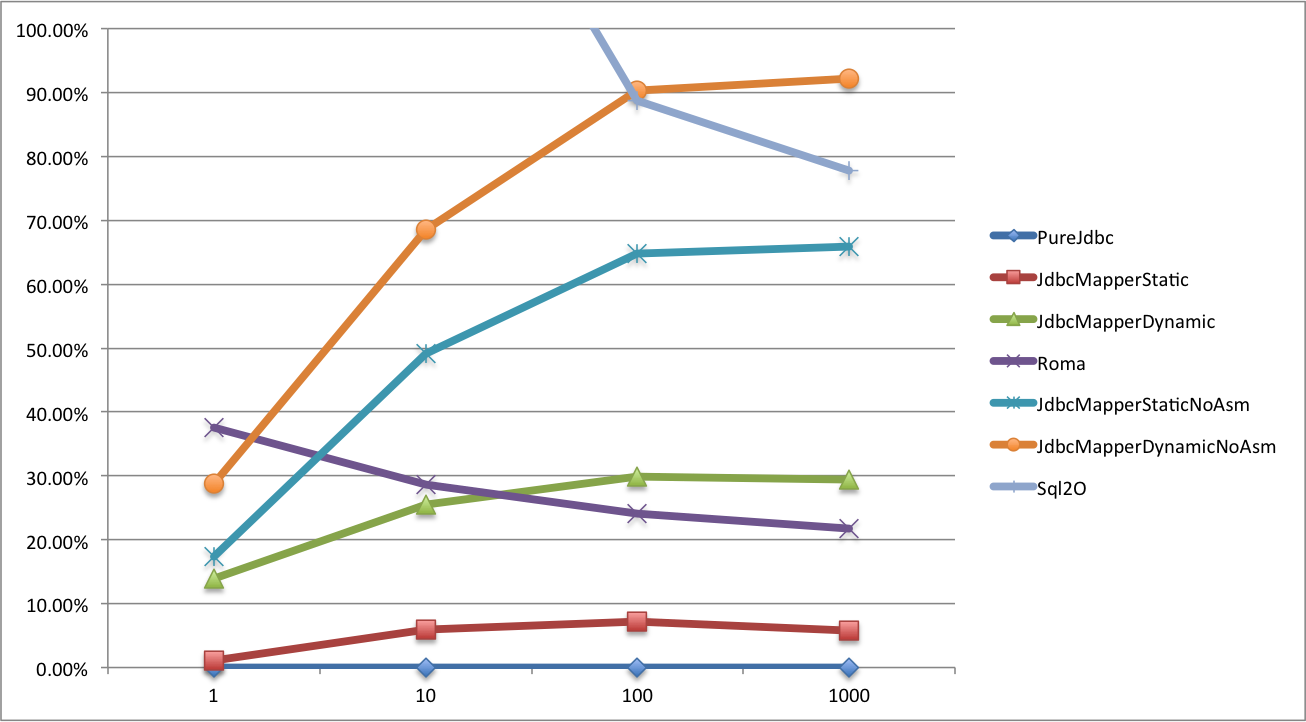
% Difference from PureJdbc Average Time Top 5, the lower the better
Average time ns/op to execute, fetch and map to object the result of a query with 1, 10, 100 and 1000 rows. The lower the better.
| Type/NbRows | 1 | 10 | 100 | 1000 |
|---|---|---|---|---|
| JdbcMapperDynamic | 244,132.45 | 303,217.51 | 667,957.81 | 2,982,436.00 |
| PureJdbc | 239,473.80 | 309,337.96 | 642,470.12 | 2,869,874.95 |
| JdbcMapperStatic | 240,930.98 | 312,776.74 | 646,734.60 | 2,867,544.47 |
| JdbcMapperStaticNoAsm | 241,145.05 | 315,291.14 | 661,614.65 | 2,913,358.80 |
| JdbcMapperDynamicNoAsm | 243,952.93 | 321,778.82 | 682,339.77 | 3,003,549.52 |
| Roma | 253,860.87 | 352,882.58 | 718,077.47 | 3,231,870.34 |
| Sql2O | 260,788.27 | 368,675.83 | 776,665.14 | 3,625,665.28 |
| Jooq.testSqlSmfMapper | 347,155.42 | 427,559.17 | 862,504.44 | 3,992,848.11 |
| Jooq.testFetchRecord | 345,209.38 | 432,352.72 | 938,448.50 | 4,531,427.84 |
| Jooq.testSqlWithJooqMapper | 350,431.61 | 438,528.91 | 892,823.06 | 4,042,104.61 |
| BeanPropertyRowMapper | 304,083.26 | 466,785.52 | 1,998,807.89 | 14,649,609.80 |
| MyBatis | 424,565.50 | 522,097.96 | 1,232,858.88 | 7,414,298.89 |
| 414,734.04 | 603,521.08 | 2,318,520.92 | 16,223,061.59 |
% Difference from PureJdbc Average Time, the lower the better
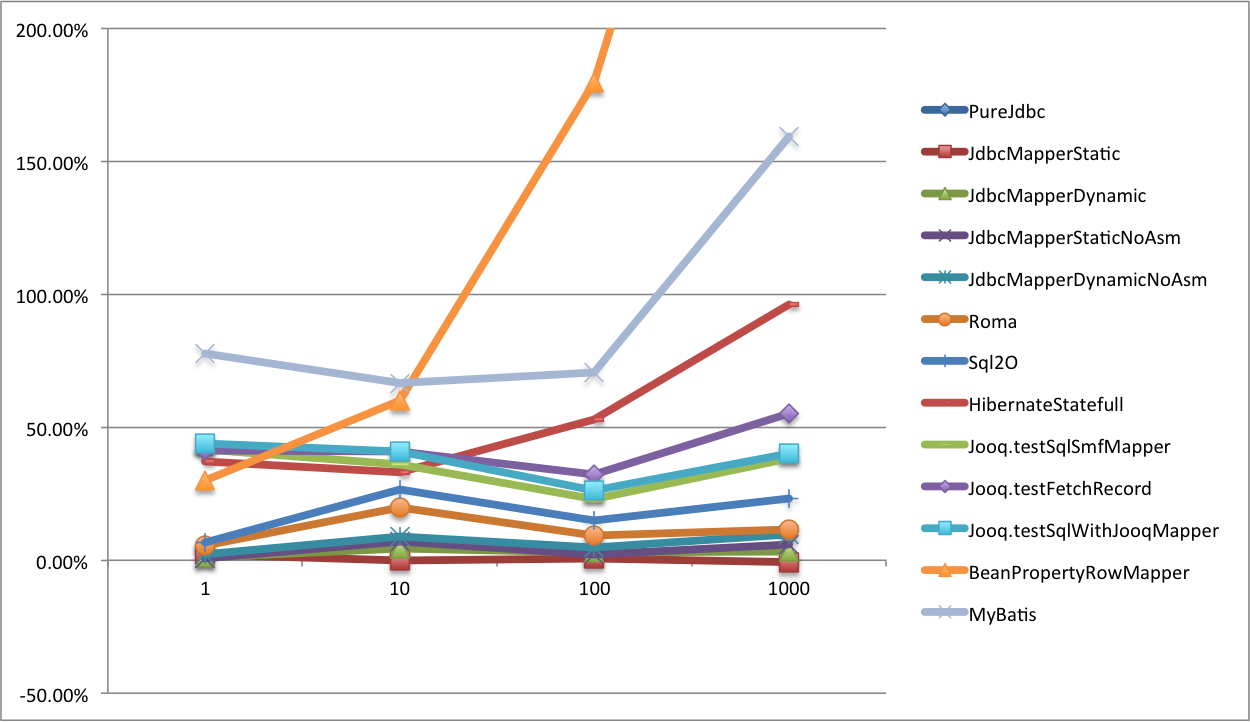
% Difference from PureJdbc Average Time Top5, the lower the better
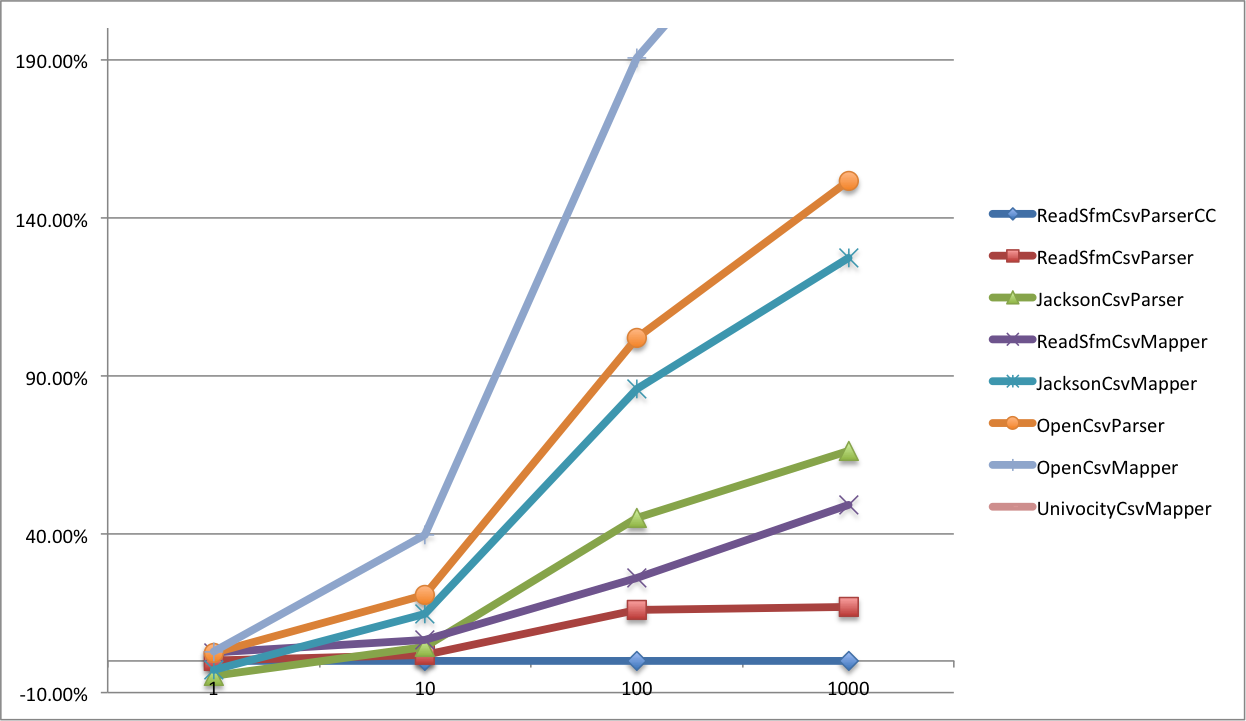
Jmh benchmark. Average time in us to parse and map to object a csv file with 10, 1000 and 100000 rows. The lower the better.
| Type/NbRows | 1 | 10 | 100 | 1000 |
|---|---|---|---|---|
| JacksonCsvMapper | 1,118.47 | 9,118.87 | 85,848.88 | 792,258.04 |
| ReadSfmCsvMapper | 2,316.74 | 6,360.36 | 54,518.06 | 569,732.59 |
| OpenCsvMapper | 2,602.02 | 13,782.47 | 127,311.26 | 1,330,882.55 |
% Difference from Jackson Average Time, the lower the better
