We read every piece of feedback, and take your input very seriously.
To see all available qualifiers, see our documentation.
Have a question about this project? Sign up for a free GitHub account to open an issue and contact its maintainers and the community.
By clicking “Sign up for GitHub”, you agree to our terms of service and privacy statement. We’ll occasionally send you account related emails.
Already on GitHub? Sign in to your account
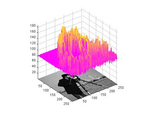
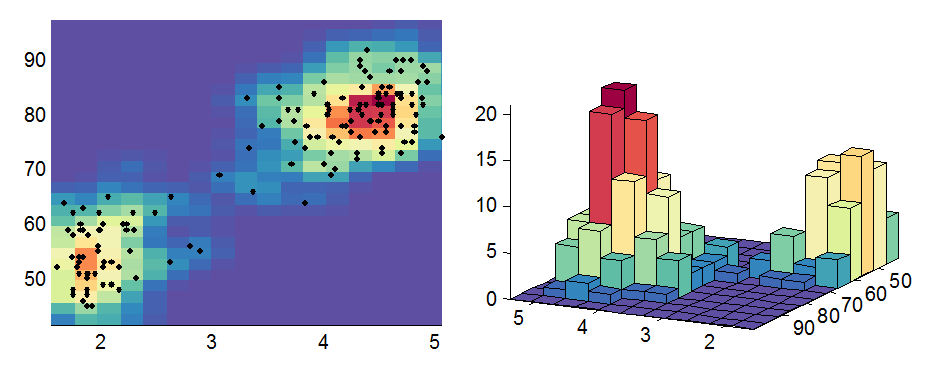
灰度图转3d 柱状图 柱状图+散点
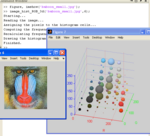
用球显示3d 直方图3D histogram of RGB image 用矩形显示3d 直方图,效果较次
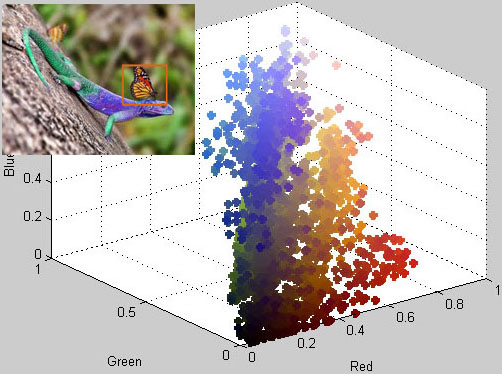
散点RGB 图
RGB/HSV Distribution http://cn.mathworks.com/matlabcentral/fileexchange/49002-rgb-hsv-distribution
The text was updated successfully, but these errors were encountered:
stdfilt gradient
改为plot点,通过密集程度判断 用o X * 分别表示 车道标记,路面,非路面 可以对圆球进行标注,不同颜色的边缘
Sorry, something went wrong.
其他
基于颜色信息的跟踪,动态 http://cn.mathworks.com/matlabcentral/fileexchange/52583-incremental-discriminative-color-object-tracker--idct-tracker-
基础工具
绘制3d泡泡 http://cn.mathworks.com/matlabcentral/fileexchange/8231-bubbleplot3 http://cn.mathworks.com/matlabcentral/fileexchange/27112-scatter3sph
3D colored bar plot http://cn.mathworks.com/matlabcentral/fileexchange/45916-3d-colored-bar-plot
No branches or pull requests
2D Hist
灰度图转3d


柱状图
柱状图+散点
用球显示3d 直方图3D histogram of RGB image

用矩形显示3d 直方图,效果较次
散点RGB 图

RGB/HSV Distribution http://cn.mathworks.com/matlabcentral/fileexchange/49002-rgb-hsv-distribution
The text was updated successfully, but these errors were encountered: