A Machine Learning model that can accurately predict the best locations to implement electric vehicle charging stations in Columbus, OH
Every day more and more Teslas are hitting the road as consumers around the United States are buying electric vehicles at a rapidly growing rate. Numerous car companies including BMW, Porsche, and Audi are all launching new electric vehicle cars in the next few years. Volkswagen has committed to creating electric alternatives for its entire lineup of vehicles by 2030, planning to sell 22 million more electric vehicles. As the number of electric vehicles exponentially grows, there becomes an immediate need for more charging stations around the country. Working with Honda and their research and development team, we wanted to answer this simple question - where should the next electric vehicle charging station be implemented? That’s where E.V.A.C. comes in - a machine learning model that can accurately predict the best locations to implement electric vehicle charging stations in Columbus, Ohio.
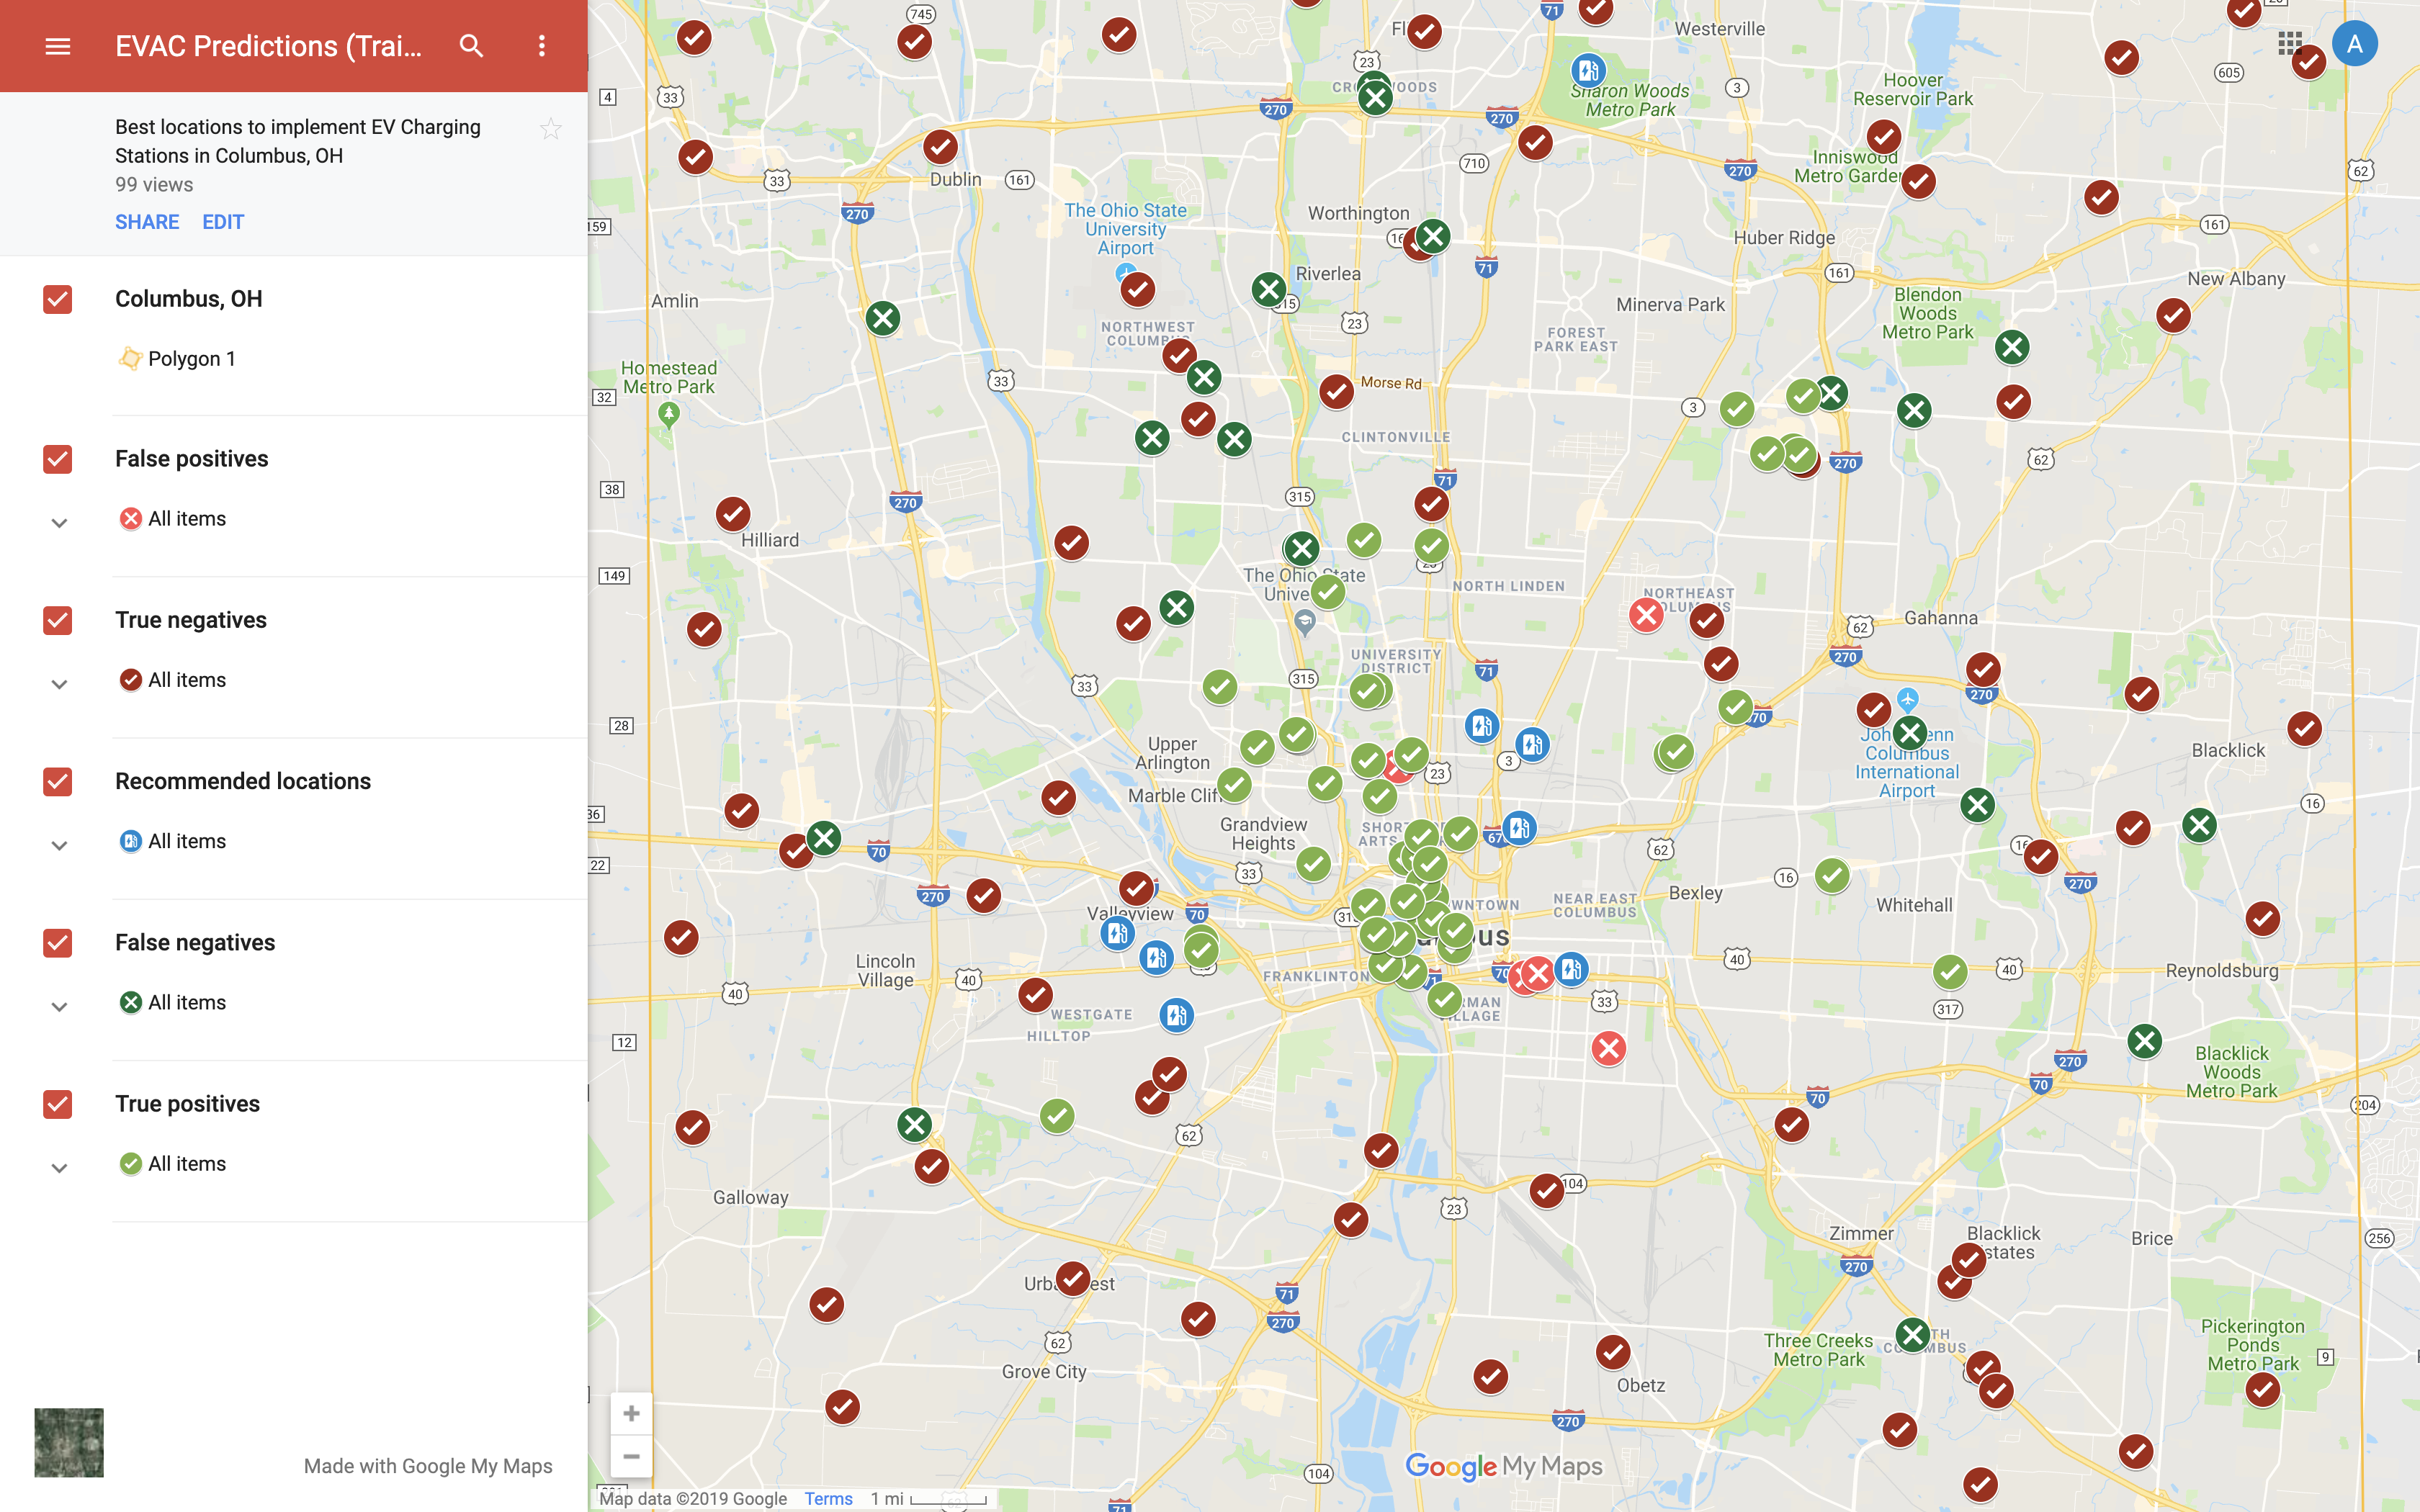
Our approach to tackling this problem was to create a machine learning model that considers a variety of features, from population density and points of interest to whether security cameras were present and the history of natural disasters in that area. After considering multiple approaches including k-nearest neighbors and neural nets, we decided to use a logistic regression model. The model takes in a set of random coordinates and outputs the best coordinates from those passed in to implement E.V. charging stations and then plots those on a Google MyMap for clear visualization of the results.
| Notebooks / Folders | Description |
|---|---|
| Exploratory Data Analysis.ipynb | The code used to generate our EDA visualizations (see Assets folder below) |
| Training_Test.ipynb | Generates all the population density, point of interest type, police camera, and disaster data for each coordinate passed into the notebook as input |
| Data Analysis.ipynb | All code that deals with our model, also includes models we did not choose but considered |
| Assets Folder | Location of all the EDA visualizations (screenshots / graphs) |
| Data folder | All the datasets we referenced in the above iPython notebooks |
| Map Folder | Input and output datasets relevant to the Live Map |
Avinash Jain, Jason Ma, Perry Trinh, Nimalen Sivapalan, Shoumik Jamil
