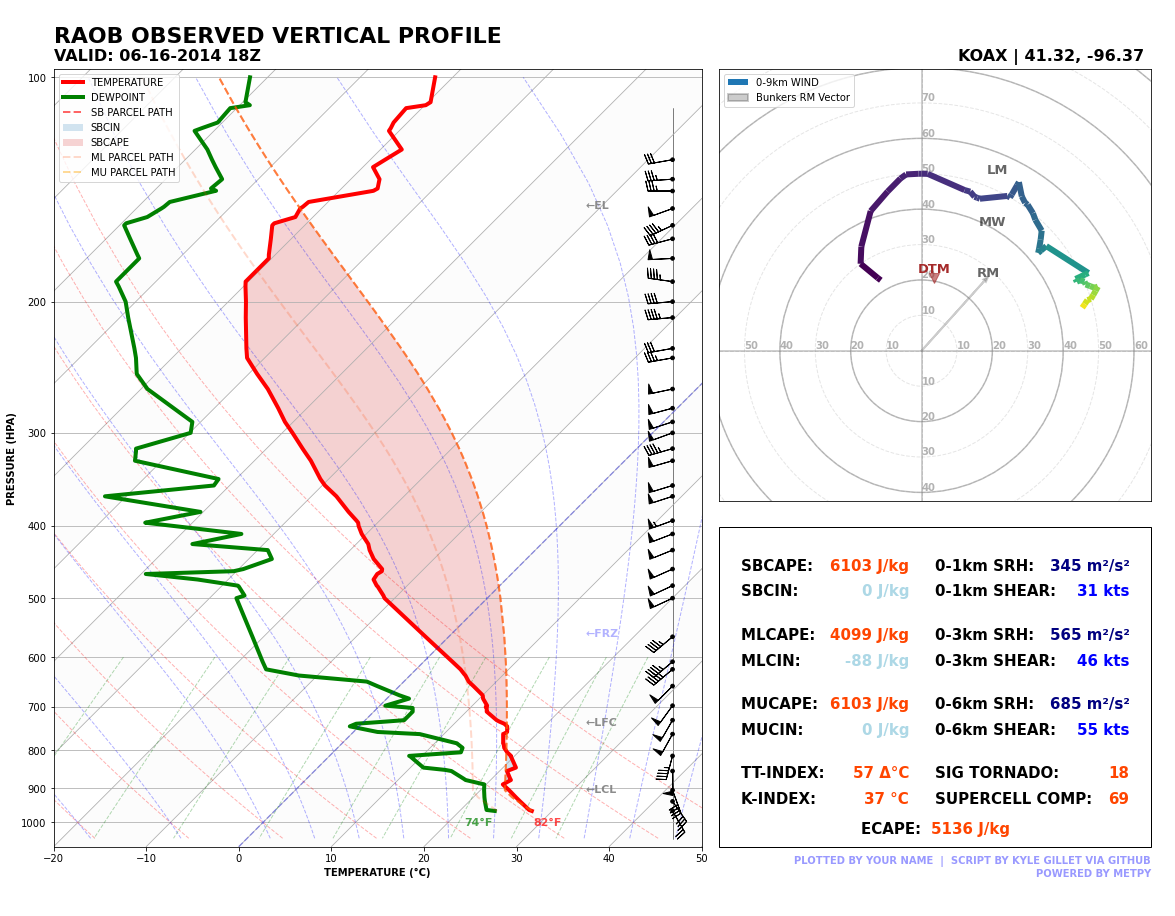
The task of this script is to retrieve RAOB data using the SounderPy module (Visit SounderPy on GitHub Here), perform a number of MetPy calculations, and plot the data on a Skew-T & hodograph.
The purpose of this script is to provide a modern, clean, clear, and concise-sounding plot that makes for quick and easy assessment of the data for environmental analysis purposes, focused on severe weather.
It should be noted that, as with any sounding plot, many of the calculations & plotting operations here shoulder heavy assumptions, and these assumptions should be well understood to get the most out of any sounding plot.
Numerous Python libraries are utilized throughout this script, including metpy, ecape, sounderpy & matplotlib Python packages. Several packages here may need to be installed onto your machine to run this code.
If you happen to run into any bugs, or have questions or ideas, please message me on Twitter (@wxkylegillett) or open an issue on GitHub.
