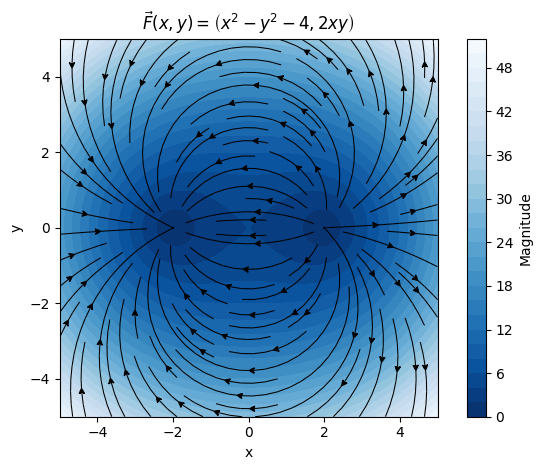
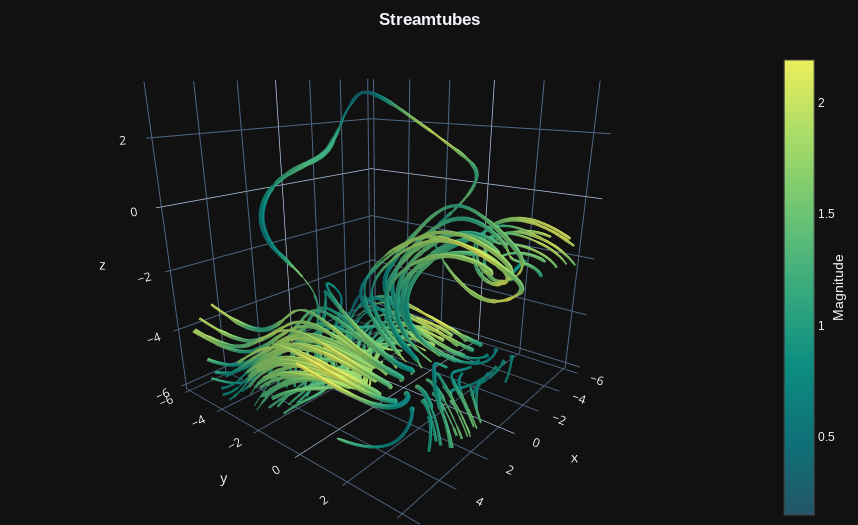
This module contains a few plotting backends that can be used with SymPy and Numpy. A backend represents the plotting library: it provides the necessary functionalities to quickly and easily plot the most common types of symbolic expressions (line plots, surface plots, parametric plots, vector plots, complex plots, control system plots).
The following plotting libraries are supported: Matplolib, Plotly, Bokeh, K3D-Jupyter.
On top of the usual plotting functions exposed by SymPy (plot,
plot_parametric, plot3d, etc.), this module offers the capabily to:
- use a different plotting library.
- visualize discontinuities on 2D line plots.
- visualize 2D/3D vector fields with quivers or streamlines.
- visualize complex functions with domain coloring.
- visualize entities from the
sympy.geometrymodule. - visualize control systems' response to input signals, root locus, as well as Bode, Nyquist and Nichols diagrams.
- create parametric-interactive plots using widgets (sliders, buttons, etc.) with ipywidgets or Holoviz's Panel.
- create animations.
Please, read the
following documentation page
to understand the differences between this module and sympy.plotting.
If you feel like a feature could be implemented, open an issue or create a PR.
If you really want a new feature but you don't have the capabilities or the time to make it work, I'm willing to help; but first, open an issue or send me an email so that we can discuss a sponsorship strategy.
Developing this module and its documentation was no easy job. Implementing new features and fixing bugs requires time and energy too. If you found this module useful and would like to show your appreciation, please consider sponsoring this project with either one of these options:
SymPy Plotting Backends can be installed with pip or conda. By default,
only basic plotting with Matplotlib will be installed:
pip install sympy_plot_backends
Or
conda install -c conda-forge sympy_plot_backends
To install the complete requirements in order to get interactive plots, bokeh, plotly, k3d, vtk, execute the following command:
pip install sympy_plot_backends[all]
If you are using zshell, the above pip command is going to fail.
Use the following instead:
pip install "sympy_plot_backends[all]"
Or, if you are using conda:
conda install -c anaconda scipy notebook colorcet
conda install -c conda-forge adaptive
conda install -c conda-forge panel
conda install -c anaconda ipywidgets
conda install -c conda-forge ipympl
conda install -c bokeh ipywidgets_bokeh
conda install -c conda-forge k3d msgpack-python
conda install -c plotly plotly
conda install -c conda-forge vtk
conda install -c conda-forge control slycot
Some backend comes with a memory cost. Since they require external libraries and/or open a server-process in order to visualize the data, memory usage can quickly rise if we are showing many plots. Keep an eye on you system monitor and act accordingly (close the kernels, restart the browser, etc.).


