-
Notifications
You must be signed in to change notification settings - Fork 16
Processing steps
To compute the whole indicators and classifications, GeoClimate chains a set of spatial analysis and statistical processes organized in 3 steps (Figure 1). It's important to note that all those processes can be run individually.
1. Building new spatial units
The first step of the GeoClimate chain concerns the construction of two new spatial units (block and RSU).
- a block defined as an aggregation of buildings that are in contact,
- a RSU (Reference Spatial Unit) is a continuous and homogeneous way to divide the space using topographic constraints sent as input data : road, railway, vegetation, water. The construction of RSUs is a major step in GeoClimate. This method consists in building a planar graph with all input geometries. The planar graph is then traversed to create new polygons. RSU are calculated in 2D and represent a partition of the ground therefore tunnels, bridges are not included. In addition, due to their climate functions, only water and vegetation geometries that have an area greater than a threshold are retained to construct RSUs. The default thresholds are 10 000 m2 for vegetation and 2 500 m2 for water.
2. Compute spatial indicators
The spatial indicators are computed at three scales : building, block and RSU. Building and block indicators are computed separately. These are indicators that qualify the morphology of the geometry (e.g a form factor) and/or its location in a geographical space (e.g distance to the nearest road, average distance to other buildings...). Building and block indicators are aggregated at the RSU scale (e.g number of neighbors per building, aspect ratio, mean building height). They are completed by indices such as vegetation, water, road fractions spatially joined from the input layers.
3. Apply classifications
Classifications use the spatial indicators to capture urban typologies as Local Climate Zones or the characteristics of urban fabric. They mixed spatial measures and statistical models.
 Figure 1. Main GeoClimate processing steps

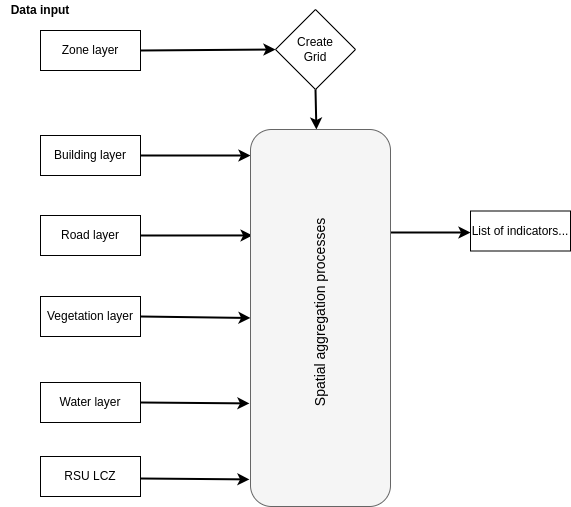
Figure 2. Processing steps to aggregate indicators at grid scale
GeoClimate - documentation 2020 - 2024 -
This work is licensed under a Creative Commons Attribution-ShareAlike 4.0 International.
